
How to Be Awesome at Biostatistics and Literature Evaluation - Part III
Well, this has been a long time coming, hasn't it?
After writing Part I and Part II of this series, my brain needed a little break from biostats. So I took some time off and wrote about other stuff for a while. One thing led to another, and it's somehow been over a year.
So let me start out by offering an apology. Especially to those of you that have written me to ask about finishing this series. I know that it's long overdue.
With that in mind, I won't waste any more of your time with sentimentality. Let's dive in, shall we?
Part I of this series gave you an introduction to the most common "fundamental" terms of biostats. You learned about mean, median, and mode, p-values, confidence intervals, and a bunch of the other basic building blocks.
Part II dove a little deeper into "applied biostats." We started incorporating odds ratios, relative and absolute risk, and hazard ratios.
In Part III (you are here), we're going to keep building off what we've learned in I and II. We're going to learn about the types of statistical tests (and when to use them).
Then, in Part IV, we'll put it all into practice. We'll go over the different types of studies you'll come across in literature. We'll also get into the nitty gritty on how to actually read an interpret medical studies (with a focus on identifying the common "tricks" that make a study seem better than it is).
As an FYI, you can also get this entire series (Parts I - IV) consolidated into a single printer-friendly and savable PDF. You can find that here.
Shall we begin?
Statistical Tests (and When to Use Them)
Remember all those fun terms we learned in Part I of this series? You know where we talked about continuous vs. categorical data? Means, medians, and modes? Good times, right?

But is it interval or ratio data?!? (Image)
But the thing is, those definitions don't really tell you much. You can look at a study and identify that it's ordinal data until you're blue in the face, but that won't tell you how to apply the data of the study to the patient that's sitting in front of you.
Also in Part I, we talked about the p-value. Most of you probably know that a p-value is one of the main "things" that helps us determine if something is statistically significant or not.
But how do you get from "ordinal data" to "p-value that shows statistical significance?"
THAT is the role of statistical tests. And your job on the NAPLEX is to identify which test to use for a given type of data. Beyond that, in life after the NAPLEX, you'll need this skill to pass any of the BPS board certification exams.
Basically, you need to be able to look at a study and determine if the conclusions reached make sense. If you just skim the abstract (just admit it, I know you're doing it), you're putting yourself at the mercy of the authors (and any bias they may have).
A big part of evaluating a study is making sure the tests they used to reach their conclusion are appropriate (and that the data they're feeding into those tests is appropriate). Even in our world of peer-reviewed studies, you'll find that that's not always the case.
How to Choose the Right Statistical Test
So, how do you know which statistical test to use? This can be daunting at first. There's a whole lotta options to pick from, and it's easy to get in over your head if you're not familiar with the tests.
I think that choosing the right statistical test is a lot like eliminating answers on a multiple choice test. You can usually knock a few 'choices' out of the running pretty easily on an exam. The same is true when you're evaluating if a statistical test is appropriate in a paper.
There are 4 key questions you can ask that will narrow your options down.
What type of data is it? (nominal, ordinal, or continuous)
Is the data parametric (normally distributed) or is there a skew?
How many study groups are there?
What is the study design? (e.g. parallel versus crossover studies)
Shhh....Listen. Do you hear that? That's the collective sound of statisticians worldwide getting offended by my attempt to over-simplify their life's work.
Is picking the right statistical test more complicated than what I'm prescribing above? Of course it is. But if you want to get more complex with it, go be a statistician.
These 4 questions will cover you throughout pharmacy school, the NAPLEX, and any board certification exam (trust me, I've passed 2 of them). I don't know about you, but that's good enough for me.
Broadly speaking, statistical tests are categorized into 2 main branches:
Parametric
Non-parametric
Parametric tests are used for normally distributed data. We learned in Part I of this series all the things that "normally distributed" entails.
The mean = median = mode. There is no skew. The data is continuous. If you don't meet ALL of those criteria, your data is not parametric (you can eliminate many a multiple choice answer with this information alone).

Recent commercial for the Kruskal-Wallis Law Firm (Image)
Non-parametric tests are used for continuous data that is not normally distributed or for discrete data that by definition cannot be normally distributed.
Non-parametric tests also tend to have names that sound kind of like a law firm or an ivy league university.
Things like "Kruskal-Wallis," "Wilcoxon," and "Mann-Whitney U."
Simple enough, right?
Alright, so with that said, let's get into a breakdown of the various statistical tests.
I'll give special focus to the more common ones that you'll run across, but first, let's start off with this handy chart.

This is our home base for the next section of this post. Get good and familiar with it. In fact, I recommend that you memorize it.
Here's how you use it...
Identify the type of data that you're working with (nominal, ordinal, or continuous)
Identify the number of samples
Line up the box where those two meet, and you've identified the appropriate statistical test
Literally, that's it. There are only 3 steps. Easy peasy.
Memorize this chart, and you'll always choose the right statistical test on an exam.
Alrighty then, let's dig a little deeper and learn more about the most common statistical tests.
Let me put out a quick reminder here too. The following tests are used to establish statistical significance. This is NOT the same thing as clinical significance or relevance. That is for you (the practitioner) to decide.
Statistical Tests for Parametric Data
So again, remember that all parametric data is continuous and follows a normal distribution where the mean = the median = the mode. Keep that in mind, because you can eliminate a lot of multiple choice options with that info alone.
Student's t-test
At its core, the student's t-test takes 2 averages (means) and compares them. You have 2 different groups, and some 'thing' that you're measuring in each of them. The student's t-test takes the average measurement of that 'thing' and tells you if the results are statistically different from each other. There's a continuous variable (the mean), and a categorical variable (the group).
Example time. Let's say we are comparing a new drug (Drug X) for hyperlipidemia to the standard of care (atorvastatin). Our primary outcome is the mean reduction of LDL. We've got 500 patients receiving Drug X, and 500 patients receiving atorvastatin. Atorvastatin lowered LDL by an impressive 38%, while Drug X weighed in at 43%.
Is that result statistically significant? Hell if I know...that's what we have the student's t-test for. The t-test establishes statistical significance.
There are two main "flavors" of the student's t-test. The independent samples t-test and the paired samples t-test.
The independent samples t-test (also known as two samples t-test or unpaired t-test) takes 2 unrelated groups and compares them. Our example with Drug X vs. atorvastatin above is an independent samples t-test. Since the 2 groups are comprised of different patients, they are unrelated.
A paired t-test, in contrast, uses the same group for both measurements. Usually you're looking for a before and after measurement (and that's a crucial way to identify it on an exam).

Give us 12 weeks, we'll take off the weight. *These statements not evaluated by the FDA. Not intended to prevent, cure, treat, or diagnose any illness. (Image)
For example, you may take a group of people and measure their weight at baseline.
Then you give them 12 weeks of your brand new Lard-B-Gone pill (patent pending).
Then you measure their weight at the end of the study.
Since the same group is giving you before and after measurements, the samples are related or paired.
Analysis of Variance (ANOVA) Tests
The student's t-test is great, but not every study scenario fits neatly into the "1 independent variable, 1 dependent variable" box.
What if we had 3 different antihypertensive drugs, and we wanted to find out which one was best? Or, what if we wanted to really complicate things and divide our study participants into groups based on age, and THEN have each of those groups take the 3 different antihypertensives to see if age had any impact on the results?
With each of these study scenarios, we've reached a level of complexity that is beyond the t-test. We need some other way to determine if our results are statistically significant. Luckily, we've got the ANOVA to walk in and save the day.
There are actually a lot of variations of the ANOVA, so to keep things simple I'll just focus on the most common/important ones for us to know.
The One-Way ANOVA
The One Way ANOVA (also known as a single factor ANOVA) compares the means of 3 or more groups in a study. Think of it as a student's t-test, but with more groups.
Let's continue with our antihypertensive example. We want to find out whether amlodipine, HCTZ, or lisinopril is the best at lowering blood pressure in a group of African American patients with Type 2 Diabetes. So we divide our study population equally among those 3 drugs, and we measure blood pressure after 8 weeks.
So that's a continuous dependent variable (mean blood pressure) and a categorical independent variable (what drug they're taking). It's the exact same set up as the student's t-test, but because there's an additional group, we have to use the ANOVA.
The Two-Way ANOVA
The Two-Way ANOVA makes the One-Way a little more complex by adding an additional factor to the categorical independent variable.
In our above case, let's say we want to measure the impact of age on our 3 antihypertensive treatments. Let's keep it extremely simple and divide our patients into "Young" and "Old." For the purposes of our study, we'll define "Old" as age >/= 65, and "Young" will be 64 years old and below.
We can keep our study design exactly the same, but now instead of 3 independent groups, we've actually got 6. If we were to make a table of our study groups, it would look something like this:

So the Two-Way ANOVA is basically the same as the One-Way ANOVA, just with an additional group in the independent variable. You're still dealing with the same continuous dependent variable.
The Repeated Measures ANOVA
This is sort of exactly what it sounds like. Think of the Repeated Measures ANOVA as the same thing as a paired t-test, but instead of only 2 measurements (before and after) you can take as many as you want.
To tie it in to our Lard-B-Gone example above, with the paired t-test, we were only able to test our study participants at 12 weeks to see how much weight was lost. If we had instead run a Repeated Measures ANOVA, we could have tested our participants at 4 weeks, 8 weeks, and 12 weeks. We could have kept testing them as many times as we wanted. The world is our oyster.
You can also run a Repeated Measures ANOVA as an extension of a Two Way ANOVA. Using our example above, our "Young" and "Old" groups of patients taking either amlodipine, HCTZ, or lisinopril could be measured at multiple time points to note any changes in blood pressure.
The Issue with All ANOVA Tests
So there's a big "thing" with any ANOVA test that you will show up on an exam sometime in your life...
The ANOVA will tell you that there is a statistical difference between the groups. However, it will NOT tell you where that difference is. Going way back to our amlodipine vs. HCTZ vs. lisinopril example...
The ANOVA will tell you that one of those groups is different (or "better" as our comically oversimplified test was measuring), but it won't tell you which one.
That's kind of a let down, right? How disappointing. It's like finding out that "someone" won The Bachelor, but not who.

Yes, I just totally quoted Dr. Seuss (Image)
Mercifully, there are some post hoc tests we can run to determine who the winner was.
Admittedly, I don't know anything about them except for what they are.
I don't know whether this one was that one, or that one was this one, or which one was what one, or what one was who.
But, I'm also willing to bet that YOU don't have to know that either. Just being able to identify the post hoc tests for ANOVA on a multiple choice test has gotten me through pharmacy school, the NAPLEX, and 2 BPS exams.
If you want to dig a little further into, here's a fairly short read. For the rest of you, here are the most common post hoc tests for ANOVA:
Tukey HSD (Honestly Significant Difference)
Bonferroni
Scheffe
Newman-Keuls
And while we're covering "testable facts," I'll also briefly point out that selecting a student t-test for a study that has more than 2 groups is a VERY common mistake. You have to use ANOVA if there are more than 2 groups. Be on the lookout for this.
Pearson Correlation
There are a number of correlation coefficients out there, but Pearson seems to be the one you'll encounter most in medical literature.

Today's correlation coefficient is brought to you by the letter "R." (Image)
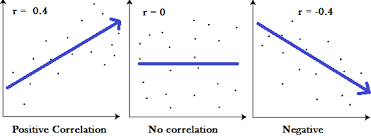
The Pearson Correlation Coefficient (also known as "r") helps us to determine how strong the relationship is between data.
It gives you a single number between -1 and 1, where:
1 is a strongly positive correlation
-1 is a strongly negative correlation
0 is no correlation
With Pearson's Correlation, the absolute value of the number indicates the strength of the relationship, and the sign (negative or positive) indicates whether the relationship is positive or negative.
So if you were to have a correlation coefficient of 0.85 (r = 0.85), it would mean that as one variable increased, so does the other. And that would be a stronger relationship than if r = 0.56.
The same is true for a negative correlation, except that as one variable increases, the other decreases. And, just like it sounds, a value of 0 means there is no correlation. The variables aren't related at all.
This is one of those scenarios where a picture really is worth 1000 words...
So here's the big "thing" to remember with correlation. It does not prove causality. I'm sure you've heard that moniker before.
““Correlation does not equal causation””
And they're right. You have to remember that you're looking at a relationship between 2 variables over some period of time, not a cause/effect analysis.
To help drive that point home, there's a fantastic website called Spurious Correlations that runs a Pearson Correlation on 2 unrelated things with hilarious results. For example, the per capita consumption of mozzarella cheese correlates with the number of civil engineering degrees (with r = 0.95!). Who knew?
Linear and Multivariate Regression
Linear Regression
If you were to just look at the graph generated, linear regression looks a lot like a Pearson Correlation. In both cases, you're dealing with continuous dependent and independent variables. In both cases you're plotting those data points on an X, Y axis. And in both cases you're trying to draw a line of best fit through those data points.
The big difference has to do with prediction.
When you're running a regression (linear or multivariate), you're predicting something.
The line you get in a Pearson's Correlation describes the relationship between 2 continuous variables. But the data points already exist, you're just making a line to fit them.
A linear regression is sort of like drawing the line before all of the data points have been plotted. Your regression line predicts the value of a dependent variable based on the value of the independent variable.
For example, you could build a regression line that predicts someone's risk of having a stroke based on whether or not they smoke.
If you haven't gotten the point by now, you should understand that regression is only used for prediction (just look how many times I've italicized the word prediction!).
That means it's only as good as the data and the model used to build it. And even if you build a great regression model, it might not work like you expect.
So always take your regression with a grain of salt. It's not that there isn't useful information to be gleaned. It's just that, at the end of the day, you're working with an equation that someone made up (and not actual data).
It probably goes without saying that the math of a linear regression can get pretty complicated. Luckily, you'll never have to do this by hand, and you can just plug your info into SPSS or some other statistics software. But if you'd like a little more reading, here's a short and sweet overview.
Multivariate Regression
Multivariate regression is similar to a linear regression, but in reverse. With a linear regression, we were predicting the effect or the outcome (the dependent variable) based on our independent variable.
With a multivariate regression, we're starting with the outcome and trying to predict several "causes" (independent variables).

(Image)
You actually do this yourself (but hopefully without SPSS) when you take some scenario from your life and try to work backwards to find out what led you to where you are.
To keep with our stroke example, we could take a population of patients that have had a stroke and work backwards to find causes that are predictive.
We might find age, gender, smoking history, oral contraceptive use, and blood pressure. We could draw a regression line for each of them to find out which factors are most predictive.
Statistical Tests for Non-Parametric Data
Not every type of data fits the bill for parametric. If your data isn't continuous, or if there is a small sample size, or there is any kind of skew, you need to use a non-parametric test.
I'll only cover one of these tests in any detail - the Chi Square test. That's because it's a super common test that deals with categorical independent and dependent variables. I'd be remiss if I didn't give it a special shout out in this article.
For the rest of the tests (the ones that sound like Law Firms), I'll only mention them in passing, and I'll mainly focus on what parametric test they are analogous to. Honestly, to be a clinician, you don't need to know them in great detail.
If you understand what parametric test the "Law Firm" tests are analogous to, then you understand what kind of data goes into them. That means you understand when it's appropriate to use them. That's more than enough to get you by.
Chi Square / Contingency Table
With the student's t-test, you compared the mean (continuous data) values of 2 groups (categorical data). With the ANOVA, you compared the continuous dependent variables of more than 2 groups.
With a Chi Square test, you're comparing two (or more) categorical variables. You may also see this listed as a "Contingency Table" if there is only one dependent variable group. So you've got a categorical dependent variable, and a categorical independent variable.
And on top of that, you can use it for as many groups as you want. So in that light, you can think of a Chi Square as both a student's t-test AND an ANOVA...but dealing with categorical data only.
The only time you can't use the Chi Square is when you have related samples (e.g. you're doing before and after measurements of the same patient population).
For example, you could run a test that compared someone's gender to their risk of developing prostate cancer (spoiler alert: I think there's a slight correlation there). Or you could compare someone's NYHA Heart Failure Classification to their risk of being hospitalized during the holidays (when most American's consume enough sodium to kill a plow horse).
These scenarios don't have "continuous" data. This makes it easy to spot when the Chi Square test is appropriate, since the data is usually going to be "yes or no" type answers.
With the above examples, did our patients get diagnosed with prostate cancer or not? Did our heart failure patients get admitted to the hospital or not. There is no shade of gray here. It's an event that did or didn't happen.
The Chi Square test shows up in pretty much every type of medical literature, because there is always a need to find statistical significance in differences between categorical variables. You'll come across it often, so be on the lookout for it's use come test time.
Other Non-Parametric Tests
As promised, I'm just going to glance over the rest of these "Law Firm" tests. The best thing for you to do is to memorize what parametric test they are analogous to, and then use them in those situations when the parametric test won't work.
A big tripping point (that you may be tested on) is to remember that since we're NOT dealing with parametric data, we are NOT dealing with means. When these non-parametric tests are dealing with continuous data, it's going to be the median.
There is no mean with non-parametric data.
So if you have a test question where there's a study comparing the mean of 2 patient populations and you're asked which statistical test is appropriate, the non-parametric "Law Firm" test is not the correct answer choice.
As a reminder, here's that awesome chart from High Yield Med Reviews. This will make your memorization task much easier.
Type of Data | Two Independent Samples | Related or Paired Samples | 3 or More Independent Samples | 3 or More Related Samples | Measures of Correlation |
| Nominal | 1. Chi-Square 2. Fisher's Exact | McNemar | Chi-Square for k Independent Samples | Cochran Q | Contingency Coefficient |
| Ordinal | 1. Mann-Whitney U 2. Wilcoxon Rank Sum | 1. Sign Test 2. Wilcoxon Signed Rank | Kruskal-Wallis 1-Way ANOVA | Freidman 2-Way ANOVA | 1. Spearman 2. Kendal Rank 3. Kendal Coe |
| Continuous | 1. Student's T-Test 2. Mann-Whitney U | Paired T-Test | 1-Way ANOVA | 2-Way ANOVA | Pearson's Correlation |
Alright, let's dive in. When I look at the above chart, here are some random observations (in no particular order) that my brain makes in an attempt to memorize everything...
Mann-Whitney U - Analogous to the student's t-test. But can also be used with ordinal data
Kruskal-Wallis - It's like an ANOVA with independent samples, but for ordinal data
Freidman - A repeated samples ANOVA with ordinal data
McNemar - A Chi Square test with related samples
Cochran Q - A Chi Square test with > 2 groups and related samples
Wilcoxon - The "signed rank test" and the "rank sum test" are not the same thing, don't get them confused on a test
Part III Wrap-Up
OK, so we've covered quite a bit. Hopefully now you're a little more comfortable with which statistical test to use when.
Again, this stuff is HUGE on BPS exams. I recently took the BCOP, where about 30% of the test questions are on stats and literature evaluation. And I'd estimate that probably close to half of those questions focused on picking the right statistical test.
Understand a few key concepts and memorize a few rules, and you'll be set for the NAPLEX and any BPS exam that gets thrown your way.
For your scrolling convenience, here are the links again to Part I and Part II of this series.
Next time, in Part IV, we're going to apply everything that we've learned so far. We'll briefly go over the types of study design that you'll come across (and the strengths and weaknesses of each). We'll then go into journal club mode to talk about the kinds of "tricks"to be on the lookout for when reading a study.
By the time you're done with the series, my hope is that you're able to get through any exam that tests you on stats, AND that you feel comfortable picking up a study and evaluating it.
Oh, and I promise to do my very best not to let another 16 months pass before publishing Part IV of this series. :)
Get This Series as a PDF!
Want to save this article to view offline? Or have a more printer-friendly version? You can get the entire series of How to Be Awesome at Biostatistics and Literature Evaluation as a single printer-friendly and convenient PDF.