How to be Awesome at Biostatistics and Literature Evaluation - Part IV
Do you know what today is?
It’s the day that we close the loop on tl;dr pharmacy’s longest running “unfinished” series.
Today, we FINALLY get to go full circle and actually apply all of that fun info that we’ve been reading about in Parts I - III.
Let’s do a brief summary to catch up the folks that are late to the party:
Part I of this series gave you an introduction to the most common "fundamental" terms of biostats. You learned about mean, median, and mode, p-values, confidence intervals, and a bunch of the other basic building blocks.
Part II dove a little deeper into "applied biostats." We started incorporating odds ratios, relative and absolute risk, and hazard ratios.
Part III focused on statistical tests (and, more importantly, when to use them). It’s a comprehensive guide on which statistical test to use for each kind of data.
In Part IV (you are here), we're going to apply everything that we've learned so far. We'll briefly go over the types of studies that you'll come across (and the strengths and weaknesses of each). We’ll talk about the kinds of bias to be on the lookout for. Then we'll then go into journal club mode to talk about the kinds of "tricks" to watch for when reading a study.
By the time you're done with the series, my hope is that you're able to get through any exam that tests you on stats - AND that you feel comfortable picking up a study and evaluating it.
As an FYI, you can also get this entire series (Parts I - IV) consolidated into a single printer-friendly and savable PDF. You can find that here.
Sound good? Good. Let’s dig in.
Bias in Clinical Trials
Throughout this article, you’ll see the word “bias” show up a few times.
What is bias? The simplest answer is that it is some flaw in the study design that gets you further away from the “truth.”
For example, if we had a researcher who knows which patients are getting placebo, and which are getting active drug, he might evaluate them differently. This is called Observer Bias.
This isn’t the researcher’s fault. It’s natural to look a little bit harder at the patient you know is getting an active treatment. And why would anyone go through all the rigamarole with someone taking a sugar pill?
Bias is a systemic issue in a study, and it’s caused by flaws in trial design. But that’s actually good news. Because that means that with a few minor tweaks, we can correct for (or at least reduce) bias.
Our Observer Bias above can be easily corrected by blinding the researcher (not literally). If the researcher doesn’t know who is getting active treatment and who is getting placebo, he’ll be more likely to evaluate everyone the same.
Before moving on, let me hammer home this basic fact:
EVERY trial has bias. There is a lot you can do with study design to control and reduce bias, but you can't get rid of it completely.
Your job is to find where bias exists in a given study, and to use that information to inform your interpretation of the study. My hope is that this article will show you how to do that.
The Hierarchy of Study Design
Peep this:
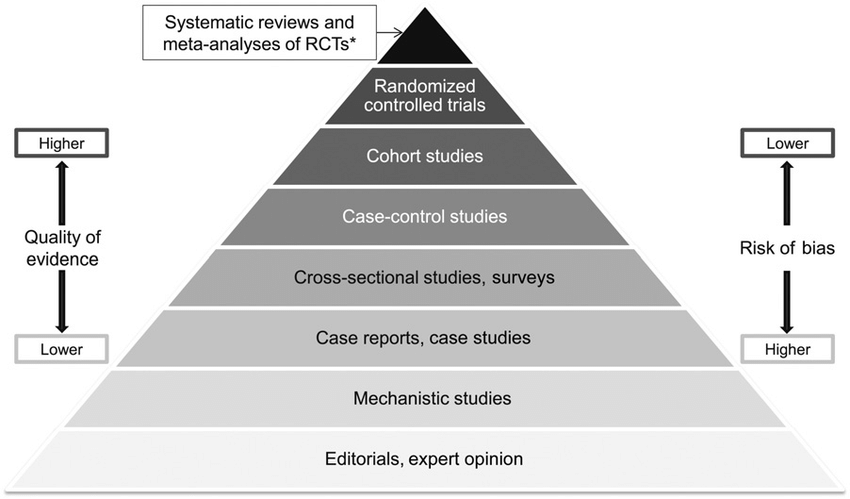
It’s like your daily food groups from the USDA, except with clinical research (Image)
You’ve seen it before. I know you have. But this is our home base when talking about study designs.
At the bottom of this pyramid is the lowest quality of evidence. And at the top, the highest.
“Quality” is a funny word, and you have to be careful with its use here. So to clarify…as you go higher on the pyramid, you have a lower risk of bias and/or systematic errors in the study.
As we just learned, bias and systematic errors can muck up your study results and make them unreliable. And we don’t want to make treatment decisions on real, live people using unreliable, questionable data.
But that’s not to say that you can’t get good information from lower rungs of the pyramid. The website that you’re currently reading lives on the bottom rung of that pyramid.
Example — when I talk about the clinical use of DOACs, you’re getting my opinion of it.

You know it’s cool… (Image)
My lone opinion is colored by my personal experience — what’s been on formulary at my workplace, the journal club that P4 presented that one time, my former preceptor’s hatred of dabigatran, and the fact that I love the “shark tooth” shape tablets of 20 mg rivaroxaban.
So while I’m reasonably educated on anticoagulant use and I’ve got actual clinical experience dealing with them, you don’t want to make a treatment decision on YOUR patient based solely on the fact that Xarelto is like a shark biting into Factor Xa!!!
You have to weigh all of the evidence yourself and come to your own conclusion.
And on the other side of the coin, there are plenty of “top of the pyramid” studies that are basically crap. You can’t just assume that because a study makes its way into some peer reviewed journal that it’s a great study. At a minimum, you can’t assume it applies to the patient sitting in front of you.
So, even though we’re using this pyramid to illustrate the hierarchy of study design, remember to maintain some perspective and to always evaluate every piece of evidence critically.
Most clinical research (i.e., research on actual people) starts with case reports, so let’s start there and work our way up.
Case Reports
Case reports live under a broader umbrella term called descriptive studies. As the name implies, a descriptive study just ”describes” what has already happened.
You’ve probably come across a case report at some point already for an adverse drug reaction that happened in a single patient. You may have even written one up for your P4 portfolio.
Case reports are low on the pyramid because they happen to single patients and they happen after the fact.
Think of all the different places where misinformation can be produced.
Let’s say a patient takes some new drug and gets a rash. You’ll have to take him on his word that he didn’t take any other new drugs. Or eat a new food. Or that he didn’t change laundry detergent or body wash. Or that his wife didn’t bring home Snuggles, a new cat that likes to cuddle in his lap.
And on top of all of that, you’re relying almost entirely on the patient’s recollection of all of that info. He’ll have to remember what he had for dinner and lunch every day for the past week. He’ll have to remember that he got a new pack of undershirts from Target and that he ran out of laundry detergent mid-load and so he had to get something from the 7-11 down the street.
And here’s the thing — even your best “historian” patients are busy and don’t remember the details of their day to day life like that. Try it with yourself right now. What did you have for lunch last Wednesday?
How good are you at remembering everything you did for the past week (if you didn’t know in advance there was going to be a quiz)?
This is a phenomenon known as Recall Bias, and it’s an issue with case reports.
However, case reports do have their place. If you string together a few of them for the same drug (a Case Series), they can inspire bigger and better trials that give you better data and more context of how that data applies. This has led to updated package inserts, new indications, and even drugs getting removed from the market.
Case Series
There really isn’t a whole lot to say about the case series. If you take a few case reports on the same drug or disease state and you look at all of them (and then report your findings), you’ve got yourself a case series.
The important role they serve is to add to the body of evidence. If one case report gets published that suggests Drug X might contribute to or cause an MI or stroke…everyone just kind of watches and waits.
But if you get 5 or 10 case studies together that say the same thing…maybe now it’s time to fund yourself a real trial.
Cross Sectional Studies / Surveys
Cross Sectional Studies (also known as Surveys) are important pieces of the study design pyramid, but you probably won’t run across them too often in a medical journal.

Make sure not to confuse the Cross Sectional Study for its more popular (and attractive) cousin, the Sectional Sofa (Image).
Their claim to fame is that they collect data at a single point in time.
That makes them great for estimating the prevalence of a disease.
However, that “single point in time” detail makes them not so great at determining the cause of the disease (or the effects of a given treatment).
On that same train of thought, the fact that it’s happening at a single point in time makes it impossible for a Cross Sectional Study to determine the incidence of a disease.
It’s probably an obvious point, but Cross Sectional Studies are also heavily subject to Recall Bias (are you noticing a trend?). You’re relying entirely on a subject’s recollection of (or opinion of) whatever question you’re asking.
Cross Sectional Studies are useful tools nonetheless. They’re quick and cheap, and they can tell you a disease’s prevalence in your study population.
Case Control Studies
Let’s continue our climb up the research pyramid, shall we?

A Study of the Effect of Stolen Plutonium on the Behavior of Libyan Terrorists (Image)
A case control study starts with the disease. Then, it travels backwards in time like Marty McFly to look at potential causes.
Let’s make up a (not so) fictional example involving patients with lung cancer.
You start with patients currently diagnosed with the disease, then you look at what they’ve done over the past couple of decades.
Are there any trends?
Did they eat too much red meat? Did they drink alcohol? Smoke? Were they exposed to asbestos? Did they work in a coal mine? Did they live 5 miles from a nuclear power plant? Do they listen to show tunes regularly?
You can literally look at any potential cause that you want. Not all of them will pan out, but you may end up finding a few potential things that are “associated with” lung cancer.
Let’s go a step further and say that our case control above indicates that smoking is “associated with” lung cancer.
You’ve now got a hypothesis that you can test with a larger trial.
Obligatory Correlation vs. Causation Side Note:
Great…so our fictional case control study showed that smoking was “associated with” lung cancer. This is NOT the same thing as causation. You didn’t “prove” anything. You will see a ton of misinformation out there (read: every single anti-vaccination meme on Facebook). As an example, Phillip J. Morris infamously produced a lot of junk scientific papers and had an entire misinformation campaign to confuse the public on the dangers of smoking.
If you’re not careful, the infographics and pretty pictures they produce can make a compelling case. But you have to zoom out and remember the Golden Maxim that “Correlation does not equal Causation.” You have to keep your BS detector well-oiled and in good working order.
In our case here, we just “noticed” that many of the lung cancer patients in our study population were smokers. Now we can use that information to fund a larger and stronger trial.

Who even brings this to a Christmas potluck, MARIA?!? (Image)
You can run a Case Control Trial on a smaller (and informal) scale too.
If 85% of your office coworkers end up with food poisoning after the holiday potluck, and all of those people ate the suspect-looking clam linguine that Maria from accounting brought in…you’ve got yourself a pretty powerful association right there.
Yes, it’s still an association, not a cause. Please don’t shun Maria because of this.
Where the Case Control really shines is in the study of rare diseases. It’s notoriously hard to study a rare disease…because it’s hard to find patients that actually have the disease.
But since that’s like, exactly, what a Case Control starts with, you will see them frequently here. And since you’re able to test multiple things at a time, you may find several things that are “associated with” whatever you are studying.
For consistency, I feel like I should mention that the Case Control Study represents yet another study design that is prone to Recall Bias.
Cohort Studies
A Cohort Study is about as close as you can get to a Randomized Controlled Trial without actually being a Randomized Controlled Trial (RCT).
The main “flavor” of the Cohort Study is the Prospective Cohort.
You start with patients without your disease of interest (note how this is different than the Case Control Study above!). You group these patients according to if they are/are not exposed to some risk factor. In our lung cancer example, you might have 2 cohorts - a group of smokers and a group of non-smokers. Then you follow both groups of patients over time and see if anyone ends up with lung cancer.
It looks like this in diagram form:
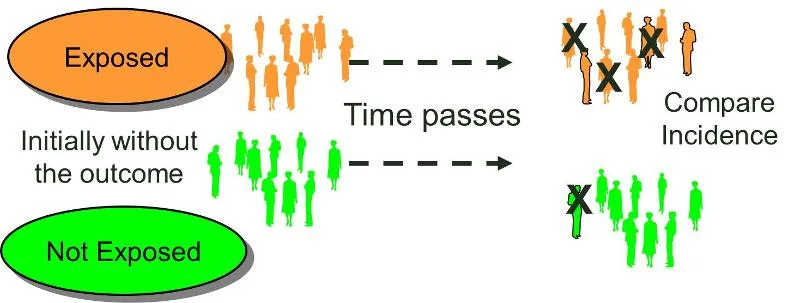
(Image)
There is also a Retrospective Cohort Study.
I think of this as a hybrid of a Case-Control and a Prospective Cohort. You start at present day with a hypothesis that exposure to some risk factor might lead to whatever disease you’re interested in.
Then you find some patients with that exposure history (they don’t have the disease of interest yet). In order to get their exposure history, you have to go backwards in time (like the Case Control). THEN, you continue following them forward in time from present day to see if they develop the disease.
It looks like this in graphic form:

The thing you’re missing, the one thing that separates a Cohort (prospective or retrospective) from an RCT is an intervention.
You’re still just watching the patients, so a Cohort Study is still “just” an observational study.
Despite that, the Cohort Study is incredibly useful. Since you’re starting your observation before the outcome (aka the disease) develops, you can get compelling data.
There are a few famous cohorts that have lead to serious changes and knowledge-advancement in healthcare practice.
The Framingham Heart Study has been ongoing for over 70 years now. It has taught us (among other things) that smoking cigarettes leads to heart disease, that high blood pressure leads to strokes, and that afib increases the risk of stroke.
This is medical information that a lot of us take for granted now. Things that sound so obvious we assume we’ve always known them. Except we didn’t. The Framingham study is where we learned all of these “common sense” pieces of practice-changing evidence.
That’s the potential power of a well-designed cohort. You can get evidence strong enough to steer medical practice.
But wait! There’s more! Since you follow patients over time, you can determine the incidence of a disease (to contrast, remember that the Cross-Sectional Study allowed you to find the prevalence…and yes, I’m bringing this up again because it’s going to show up on an exam at some point in your future. You’re welcome.).
And you can use the same cohort to figure out multiple outcomes. For example, the Framingham Study also taught us about the role of blood pressure in contributing to the following:
Heart attacks
Strokes
Heart failure
And kidney failure
The main negative with Cohort Studies is that we cannot fully control for confounding variables. Since they are observational studies, we can’t be sure whether the exposure we are looking at is really the “cause” of the disease. We also have yet another healthy dose of Recall Bias with Cohort Studies (particularly with Retrospective Cohorts).
And so, despite their strength, we still can’t determine causality with a Cohort Study.
Case Control vs. Prospective Cohort vs. Retrospective Cohort
You may have noticed a bit of overlap with the last 3 observational study designs. The differences between a Case Control and a Cohort Study are common points of confusion (and also a common test questions).
This wonderful image sums up the differences perfectly:

Notice that all study designs are dealing with exposure and with a disease of interest. The differences are when the researcher gets involved and when the patient develops the disease.
The Case Control is fully retrospective. You have patients who’ve already developed the disease. You look backwards in time to see their exposure history. This is super useful for rare diseases, because (by definition), your patients already have the disease of interest.
It’s also noteworthy that you CANNOT use Relative Risk in a Case Control Study (we covered this in Part II of this series…but the graphic above also summarizes the point nicely). This is also a very common test question.
With the Prospective Cohort, the patients have already been exposed (or not) to the risk factor before you start the study. You just follow them forward to see if they develop the disease of interest.
And the Retrospective Cohort is a little of Column A and a little of Column B. It’s part retrospective and part prospective. It combines the retrospective aspects of the Case Control (finding the exposure history) with the prospective aspects of the Cohort (following forward in time to see if the disease of interest develops).
Randomized Controlled Trial
The Randomized Controlled Trial (RCT) is the benchmark that every other study design is compared to.

Not THAT kind of intervention… (Image)
It’s the “gold standard” of clinical literature.
Why?
Because we can FINALLY determine cause and effect.
As a matter of fact, the RCT is the only kind of study that can establish cause and effect.
We are no longer just observing patients and seeing what happens.
With the Randomized Controlled Trial, we finally have an intervention.
It looks like this in picture form:
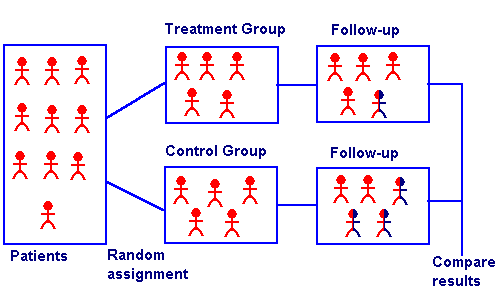
So you take a group of patients. You randomly split them into either a control group or a treatment group. Then you see what happens.
Why is this so powerful?
First of all, like the Prospective Cohort, you are following your patients over time. Not only are you following them over time, but you are following them both before and after your intervention.
The “randomized” part of the RCT is also critical. It takes your pool of patients and randomly splits them into either the control or treatment group. This prevents an important type of bias called Selection Bias (it’s also known as Allocation Bias).
Imagine I have some new drug that treats pancreatic cancer, and I want to see if it extends overall survival compared to the standard of care. As a researcher (and stakeholder in the drug company), I have an incentive to show my new drug looking good. The easiest way to do that is to assign healthier patients to the treatment group (my study drug). The very sick patients who are practically on Death’s doorstep? They get standard of care.

Randomization vs. Selection Bias (Image)
At the end of the study, I’ll be able to say:
“Look! Look! Patients that took my drug had better overall survival! They lived longer! My drug is better!”
That’s Selection Bias, and randomization stops it dead in its tracks.
The “Controlled” part of the Randomized Controlled Trial is also important.
This means that we compare our intervention against something else. Otherwise, you might see a change in your patient population just because they are being studied (this is notorious in weight loss studies - the mere fact that they’re being monitored causes patients to change their diet/exercise habits. This is called The Hawthorne Effect).
The control group can either be a placebo or another active drug (usually we’ll compare our new treatment to whatever is considered the standard of care).
You might compare your new antidepressant drug against a placebo. However, you probably won’t compare your new antibiotic against a placebo, as that would mean witholding treatment from your control group.
Having a control group prevents the placebo effect. It lets us know that any changes seen in our treatment group are actually due to the intervention. The key is that the control group has to be made up of the same kinds of patients as the treatment group (again, this is where randomization comes in).
So when you combine all of that (following patients both before and after an intervention, randomly allocating patients to their study group, and comparing the treatment group against a control group), you’ve got yourself data that’s powerful enough to establish cause and effect.
But there are a few other fun things you can do with an RCT to even further reduce bias.
First, you can have the trial take place in multiple locations. This ensures that you have multiple, diverse investigators evaluating the patients in the study. Studies that occur in small treatment centers may suffer from Investigator Bias because there might be only 1 or 2 researchers actually evaluating patients and their response to the study treatment.
RCTs can also be blinded (the patients don’t know if they are in the control group or the treatment group) or double-blinded (the patients don’t know if they are in the control group or the treatment group…AND the researchers don’t know either).
Blinding is a great way to reduce bias in clinical trials. Single blinding prevents the placebo effect since the patients don’t know if they are receiving active treatment or a placebo. And double blinding prevents researchers from evaluating patients in control vs. treatment groups differently (Observer Bias).
Finally, you can have a Crossover Study.
It looks like this:

The advantage of a Crossover Study is that patients act as their own control group. You don’t have to worry about making your control group and your treatment group as similar as possible - because each patient is in BOTH the control group and the treatment group.
The disadvantage is that it takes a long time to conduct a Crossover Trial. You have to ensure an adequate washout period to make sure the effects seen in Phase 2 of the trial aren’t actually due to the interventions in Phase 1.
This makes The Crossover Study expensive. It also makes it a bad choice for conditions that need urgent treatment (like sepsis or MI).
As someone who works in health care, you need to be familiar with RCTs.
They are the most important kind of clinical literature. You will be doing your journal club presentations on RCTs. The guidelines you read are going to be driven by RCTs. All of the statistical terms and tests that you learned in Parts I, II, and III of this series relate to RCTs. That 6000 word article we posted on the p-value is about RCTs. The article we dedicated to Absolute Risk Reduction is used for RCTs.
RCTs are that important. So you need to be comfortable with reading and evaluating them.
Meta-Analysis
Let’s use an SAT-style analogy:
Meta-Analysis : Randomized Control Trial :: Case Series : Case Report
To be fair, a Meta-Analysis is wayyy more complicated than a Case Series. But the idea is the same. A Meta-Analysis is a mashup of several RCTs pooled together. The idea is that by combining RCTs, you make a larger group of study patients, which can make your data is even stronger.
That’s why you’ll see the Meta-Analysis sitting on the very top of the Study Design Hierarchy pyramid.
When performed correctly, it’s even more powerful than an RCT.
You just have to make sure it’s performed correctly. There are a few biases in a Meta-Analysis you need to watch out for.
First of all, you have to remember the old adage: “Garbage In, Garbage Out.” If you put poorly-conducted clinical trials together in a Meta-Analysis, you don’t magically have a good study. A Meta-Analysis cannot correct bad studies that are placed in it.
Similarly, you want your patients to be similar across all trials. It’s not really good “science” to have a trial studying asthma in children aged 2 - 8 combined with a trial studying asthma in adults aged 65 - 80.
On that note, most meta analyses these days report a statistic called I2. This is an attempt at describing whether differences amongst the included studies’ treatment effects are due to chance versus being due to heterogeneity (aka variation between studies based on population, intervention, methodology, etc.).
Basically, the I2 aids in our interpretation of whether the effect from a meta analysis is because a limited number of apple varieties were included versus whether some oranges and bananas snuck in there too… In turn, this helps us to make determinations about the utility and generalizability of the meta analysis conclusions.
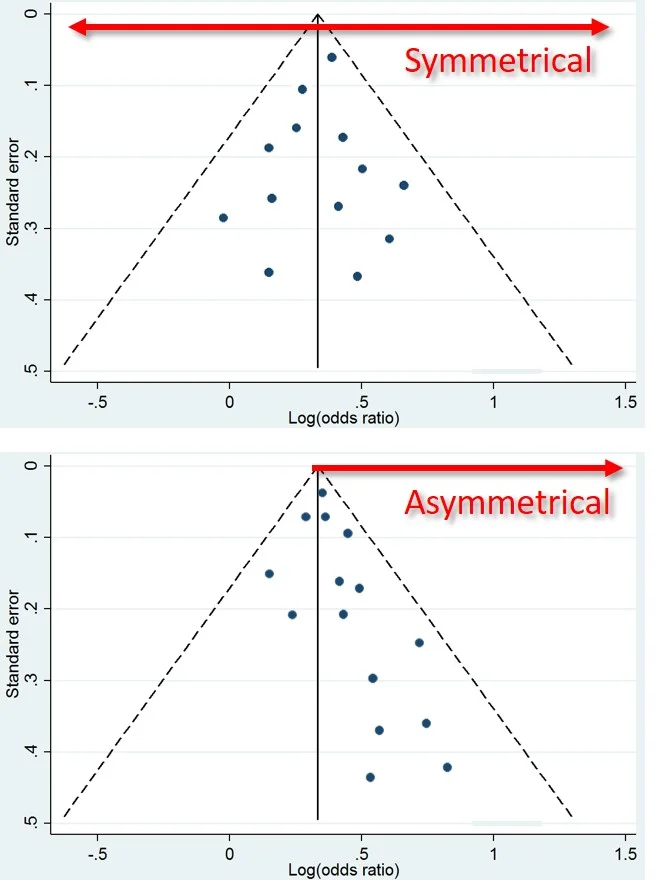
This is what a Funnel Plot looks like. Top = Good. Bottom = Bad. (Image)
You also need to be mindful of Publication Bias.
There’s a tendency in clinical literature to NOT publish research that has negative or insignificant results.
There could be several reasons for this.
It could be a sneaky ploy by pharmaceutical companies to hide away trials which show their products not working.
Or it could just be that insignificant results don’t make for sexy headlines.
For some reason, negative trial results “feel” like failures, and no researcher wants to put their name on a failure.
As you can imagine, this can really skew the results of a Meta-Analysis.
But there’s a tool at your disposal. Any Meta-Analysis worth its salt will include a Funnel Plot.
You want to see your trials evenly distributed among negative and positive results…NOT clustered on one side of the funnel.
How to Read a Clinical Trial - Best Practices
Let me start with an obvious disclaimer.
I can’t teach you everything you need to know about literature evaluation in a few paragraphs. You already know I’m kinda wordy. It’d literally take me a book to get all of these points across (and that’s assuming I know everything about literature evaluation…which I don’t). Maybe one day, I’ll make that happen.
In the meantime, here is a book on evaluating clinical research that I highly recommend. Honestly, I can’t recommend this book enough. It’s one of the biggest contributors to my literature evaluation skills.
What I CAN teach you are my best practices. These are the steps that I do every single time I look at a clinical trial. And I can give you some of the things that make my BS Detector go off so you can add them to your repertoire. So, in no particular order, here is a list of tips on how to read a clinical trial.
First and foremost…
Read Beyond the Damn Abstract
I know this seems obvious, but hear me out. Look. I know you just glance at the abstract when you’re in a rush. I do it too. We all do it. Don’t worry - tl;dr pharmacy is a judgement free zone and a place for friends.
But IF you’re only going to read the damn abstract, at least have the sense to consider it as nothing more than a clickbait headline.
Otherwise, you’re setting yourself up for problems. Abstracts are sneaky. And “unbiased” summaries of these abstracts are frequently published in the daily digests from professional organizations that show up in your inbox every day.
I’m not trying to pick on anyone…but here’s an example that recently showed up in my Gmail:

A screenshot from my inbox
Let’s click on that link, shall we? (You can click on it too…it’s right here.)
This publication comes from The ASCO Post. ASCO is one of the biggest and most important sources of oncology pharmacy information. I frequent ASCO, and I get the ASCO Post delivered to my inbox every day.
Before I get into trouble, I should note the disclaimer at the bottom of every page on the ASCO Post site: “The content in this post has not been reviewed by the American Society of Clinical Oncology, Inc. (ASCO®) and does not necessarily reflect the ideas and opinions of ASCO®.”
That fact alone probably trips a lot of people up. The ASCO Post doesn’t reflect the stance of ASCO. Who knew? But alright, whatevs, moving on.

Pulled straight from the article
Here’s a screen shot of the Key Points from the CASSINI Trial —>
Seems like rivaroxaban is the bee’s knees for preventing VTEs in cancer patients, right?
But guess what happens when you read the actual article these Key Points are pulled from…
You’ll find that the difference in the primary efficacy endpoint was NOT SIGNIFICANT between the two groups.
That important detail is curiously absent from the Key Points.
Also note the leading language they’ve used. Notice how it gives your opinion to you, as if it’s trying to persuade you of something?
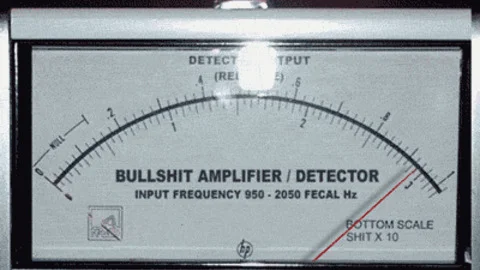
Here’s a good rule of thumb for literature evaluation - any time you see salesy phrases like “substantially reduced risk” and imprecise figures like “just over 23%,” your BS detector should be right about here:
Your BS Detector when you see the phrase “approaching significance” in a trial summary. (Image)
Let’s also go back to the summary that arrived in my inbox:
A new study suggests taking a direct oral anticoagulant can reduce the risk of harmful blood clots in patients undergoing cancer treatments, without substantially increasing the risk of bleeding problems.
The emphasis added is mine. Just to be clear, the risk of major bleeding in this trial was not statistically significant between the 2 groups. So the above statement isn’t wrong.
But, twice as many people in the rivaroxaban group experienced a major bleed compared to the placebo group (8 patients compared to 4 patients). Statistical significance be damned, but a doubling of major bleeds is huge to you if you’ve ever dealt with one before. The numbers seem small now, but if the results of this trial were to change clinical practice, do you know how many patients this would potentially effect?
And finally, look at how the patients were selected for this trial (a more detailed abstract can be found here). Patients were selected based on their Khorana Score, which determines an increased risk for VTE.
If you don’t know what that is (I sure didn’t), the Khorana Score a risk-stratification system made up by (and named after) the lead investigator of this trial. I’ll bet you’re curious if the Khorana Score has been validated by anyone else.
It’s been looked at, but according to this review, the Khorana Score missed the mark in a retrospective analysis of cancer patients with confirmed DVT.
Alright. So the lead author of the CASSINI trial uses his own (possibly inaccurate) scoring method to select patients for the study. Then he doesn’t achieve a significant difference in his primary endpoint…but the resulting abstract says that there’s a “substantially” reduced risk of clotting in the treatment group (because of a predetermined secondary analysis).
Any problems here?
Oh! One last thing. Per the disclosures, the author is a consultant for Janssen (who makes rivaroxaban).
What am I getting at with all of this?
It may surprise you, but I’m actually NOT trying to convince you that the CASSINI Trial is bullshit. Nor am I trying to paint the author as “on the take” from Janssen. Honestly, I mean no disrespect to anyone.
I’m just trying to show you that with literally 5 minutes of critical thinking (and a couple of clicks) you can uncover worlds of bias that provide context to the abstract you’re reading. And context is of utmost importance when it comes to literature evaluation.
Every single trial has positive and negative qualities. Every study is biased in some way. There are a lot of things I like about the CASSINI trial…and a lot of things I dislike about the analysis that disagreed with the Khorana Score. Notice that I haven’t gone into the details of either study. I’m just showing you what can happen if you don’t dig a little further.
And I hope you’ve learned this by now, but I have my own biases that you need to consider whenever you read anything (like this article) on tl;dr pharmacy (Buy One of Our Cheat Sheets Here!!) —>Do you see what I did there? :)
But by looking at just a little bit more than the bare minimum (the abstract), you can learn about the pros and cons of the study you’re reading, and whether or not it applies to the patient sitting in front of you.
If you let people fill in the conclusions for you, they will be more than happy to do so. Then you end up making recommendations that affect YOUR patients based off of a biased news summary in your inbox that came from the biased abstract of a biased study.
Making Claims of Superiority in a Non-Inferiority Trial
Forgive me for again using an oncology example, but I’m an oncology pharmacist. These things just show up in my day-to-day work life.
Allow me to refer you to the Lenvima website for its recently-approved indication of Hepatocellular Carcinoma. This data comes from their REFLECT Study, which was a non-inferiority study (non-inferiority studies are powered in such a way that they aren’t trying to prove that the treatment group is “better” than the control group…just that it’s not worse than the control group).
First of all, notice the lovely green box around the primary endpoint of Overall Survival (sorafenib doesn’t get its own green box). If you read down to the footnote (also lacking a green box) you’ll see that lenvatinib was not better than the standard of care of HCC (sorafenib) at prolonging Overall Survival. That’s expected because this was a non-inferiority study.
Now let’s look at those secondary endpoints. Here we see lenvatinib showing statistical superiority for Progression Free Survival and Overall Response Rate.
At this point, your spidey sense should be tingling.
You technically can design a non-inferiority trial and then analyze it as a superiority trial. But there are pretty strict dos and don’ts when doing this.
And either way, the practice is generally (at least in the circles I walk in) not welcomed with open arms. It’s looked at as a form of data dredging. You’re changing the analysis of your data after the fact in a way that your trial wasn’t designed for. And you’re doing it in a way that clearly benefits you financially.

“The data looks good, let’s take a chance with a superiority analysis!” (Image)
It’s like crossing the streams of your proton packs.
It can be done, but only in dire situations when the fate of the world hangs in the balance (such as when sending demons back through an inter-dimensional portal).
In the case of lenvatinib for HCC, it doesn’t necessarily invalidate the data in my eyes. But it makes me regard it with caution. It doesn’t make me want to to switch all of my sorafenib patients to lenvatinib. I just consider this as another option for HCC (with a different side effect profile than sorafenib).
When you’re reading the latest sexy study, watch out for this trick. It’s more common than you think.
Always Calculate Absolute Risk
I’m not sure I can write much more about this. I’ve written an entire post about Absolute Risk Reduction here. And I covered it pretty extensively in Part II of this series.
Absolute Risk is almost never presented to you in a clinical trial. It’s not a headline-grabbing number, and it’s WAY less sexy than its attractive cousin Relative Risk.
But Absolute Risk is a much more important number when evaluating the usefulness of a study than Relative Risk. Because Absolute Risk actually takes into account the likelihood of the event happening in the real world.
Let’s illustrate with the heart failure medication Entresto. You have a study that shows a 19.4% RRR of cardiovascular death in heart failure patients using Entresto compared to enalapril. You've possibly seen advertisements claiming that Entresto reduces your risk of death by 20% (because rounding). The ARR is not mentioned in such stories. But in this particular case, it's 3.2%.
That's nothing to sneeze at (this study was actually stopped early due to the benefit seen in the Entresto group). But you don't need me to tell you that 3.2% <<< 20%.
As a further note on Absolute Risk, you need it to calculate Number Needed to Treat (which is a handy way to quickly estimate the real world value of a drug). AND if you plan on taking the NAPLEX or a BPS exam anytime soon, you’ll be calculating a lot of Absolute Risk.
Make Sure the Study Results Apply to YOUR Patients
There are multiple facets to this rule that I want to cover.
The first facet is somewhat obvious. If you work with pediatrics, a trial that studied meningitis treatment in Alzheimer’s patients probably isn’t going to overlap much with your meningitis patients. Sure you might get a useful nugget or two, but you probably don’t want to direct all of your effort adopting the strategies recommended in the study.
You can go further than this though…
Think about the last 5 studies you read. No matter what the subject was, how many of the trials excluded the sickest of the sick patients? The septic patients that are on CVVH. The cancer patients that have an ECOG status bordering on 3. Maybe the patient isn’t even that sick. What if it’s a sweet 87 year old lady with hypertension and hyperlipidemia?
Got a mental picture? Good. Now, how many of these patients were in the last 5 studies you read? Do those studies represent the patient that’s sitting in front of you now for counseling? How much data do you have that supports how to manage their treatment?
And still, you can go a little further than that…
Steroids are often used in cancer therapy to prevent chemo-induced nausea and vomiting (CINV). At the time of this writing, NCCN guidelines recommend 4 days of dexamethasone 8 mg for highly-emetogenic regimens.
But what if your patient has poorly controlled diabetes? 8 mg of dexamethasone is the equivalent of over 200 mg of hydrocortisone. Do you really want to give that to your patient every day for 4 days (and then repeat it every few weeks for each chemo cycle)? Do the recommendations for CINV apply to your diabetic patient?
Let’s go deeper down this rabbit hole…
It’s a pretty well-known fact that Caucasian males are over-represented in clinical literature. And every year, we learn more about pharmacogenomics. Specifically that certain populations of people express different levels of a given enzyme or protein - and that these genetic differences cause significant changes in how drugs behave in different populations.
There are estimates that as many as 30% of people of Ethiopian descent are ultra-rapid CYP2D6 metabolizers. This has led to several issues - most notably in 2017 when (after several reported fatalities) it was recommended to not give codeine or tramadol to pediatric patients.
But CYP2D6 is responsible for a whole lot more than codeine, isn’t it? Many, if not most antidepressants, beta blockers, opioids, and more go through this important enzyme.
I’m cherry picking an obvious example, but hopefully you see my larger point. When over 80% of clinical trial participants are Caucasian males, what happens when you apply the data from those clinical trials to your Vietnamese female patient?
Who knows? But it’s probably not good.
We already have one drug with a race-based indication. We have genetic testing for HLA subtype recommended in some populations, but not others. We’re only scratching the surface here. How much are we missing by not figuring this stuff out before a new drug makes it to market?
All in all, this is yet another potential source of bias, and it should influence how you read each and every clinical trial.
Using Composite Outcomes
We gave a shout out to composite outcomes in our first (and to date, only) tl;dr journal club article on the COMPASS Trial. But let’s kick the tires on this again.
A composite outcome is when you lump several (hopefully similar) outcomes together. You’ll see this all the time in cardiology literature. Things like stroke, MI, and cardiac-related mortality are lumped together as a primary outcome to determine if some new anticoagulant reduces their risk.
And in a context like that, composite outcomes make sense. Stroke, MI, and mortality are all well-defined and non-subjective. They are all relative to someone researching anticoagulation, and there is little wiggle room to misinterpret them.
But what if you added something more subjective to the composite outcome? Something like angina? Or hospitalization? These could be markers of effective treatment. But what if the patient is hospitalized for some other reason? Does that matter? And who is defining (and grading) the angina?
That opens up a lot of room for our friend Mr. Bias, doesn’t it?
A general rule for composite outcomes - the more subjective the outcome(s), the more your BS detector should be alarming.
Data that Doesn’t Meet Criteria for Significance is Not Significant
It feels kind of funny to have that as a section title, but this is one of the most common problems with interpreting clinical trials.
If your pre-specified protocol determined that you need a p-value of < 0.05 to achieve statistical significance, what happens when you get a p-value of 0.063?
What about 0.051?
Is your result significant?
No, of course not, right? Because it’s not less than 0.05. This is obvious and we all understand it without a lot of explanation.
But is your data “approaching significance?” I mean, 0.051 is basically 0.05, right? You could say that there is “a trend towards significance,” couldn’t you?

(Image)
For a detailed explanation on why this is true, check out this post. Or this page on Wikipedia. Or this article.
In another common misinterpretation of the p-value, having a p-value of < 0.0001 does not make your data “super significant.”
Using p-values as an indicator for statistical significance is a yes or no thing. It’s not a measure of magnitude. You either achieved significance, or you didn’t. There is no in between.
When you read the discussion section of a study, you’ll see authors trying to rationalize their failed primary endpoint with phrases like “trend toward significance” or trumpeting their p-value of 0.0001 as “highly significant.” Don’t fall for this. It’s either an error in interpretation on their part (most likely) or they are intentionally trying to mislead you.
The Devil is in the Details…but Don’t Forget the Big Picture
The only way you’re going to understand a study (and if it applies to your patient) is to dig into the details.
But you need to be able to do more than just regurgitate secondary endpoints and verify that a p-value is below 0.05. As we’ve written about before, just because a study shows up in a “quality” journal and has p-values of < 0.0001, that doesn’t mean it’s still a “good” study. And it certainly doesn’t mean the study applies to your patients.
Here’s an example.
The biosimilar drug Retacrit was recently approved by the FDA. As a biosimilar to Epogen/Procrit, Retacrit can now be used for any and every indication that Procrit has an approval for. This includes CKD-induced anemia, chemotherapy-induced anemia, zidovudine-induced anemia, and surgery.
But if you dig into the data…guess how many of those diseases were actually studied in the clinical trials for Retacrit?
Just CKD. The only patients that saw Retacrit before it was approved were patients with kidney disease. The rest of the indications were extrapolated from the existing data.
Now, I’m not saying that Retacrit won’t work just the same as Procrit in every indication. I’m not even saying that the process of data extrapolation is wrong. It would be astronomically expensive to conduct a study for every indication, and I realize that this realistically won’t happen.
I’m just saying that we don’t technically know if Retacrit will work and be safe in chemo-induced anemia because it hasn’t been studied. And that I can use this information to inform my practice decisions and recommendations. At the bare minimum, the patient might want to know this information.
As another example, I’ve written before about my initial hesitance to use apixaban in hemodialysis because the data that led to that recommendation was based on a single dose pharmacokinetic study conducted in 8 people.
Both of these examples are not “surface level” data. You have to really dig in the package inserts to even discover them. You have to go and look at the actual studies that got the drug approved and evaluate them. It’s not easy.
But you have to hone this ability if you want to be the best pharmacist you can be.
At the same time, you have to be able to zoom out to a forest level view sometimes. Otherwise you’ll go cross-eyed and get overwhelmed playing Sherlock Holmes while doing literature evaluation.
The end goal is being able to apply minor details while keeping the big picture in mind. You’ve got to be able to keep all of your findings in context, and not get distracted by Shiny New Drugs.
Let’s say I task you to do a topic discussion on migraine prevention, an area that you’re not super familiar with. If you start your research with a Google search, you’re going to see a ton of articles about CGRP. It’s a new drug class, and 3 of them have been approved recently.

No unicorns were harmed in the making of Aimovig (Image)
As you continue your research, you start seeing these drugs everywhere.
You’ll see advertisements for it when you’re watching Hulu.
They’ll show up as sponsored content in the digest that gets emailed to you every day.
And the promotional hype makes it seem like the drugs are distilled from unicorn tears.
What’s the problem here? If you’re not careful, you are going to weigh all of this new evidence more heavily than the tried and true standbys (this is called the Recency Bias). It’s going to skew your topic discussion (and eventually your treatment recommendations).
Have you ever seen an advertisement for propranolol as a migraine prevention? Me neither.
Newer drugs certainly have a place in therapy. And every so often, drugs that are truly game changers come along (like the $1000 per pill miracles from Gilead used for Hepatitis C). But you’ve got to be able to place them in context with current treatments.
Your task in literature evaluation is two fold.
On the one hand, you need to be able to drill deep enough into a study to find out if it’s bullshit. You need to critically think about about the study design and the patient population to determine if the conclusions reached make sense.
At the same time, you’ve got to be able to zoom way out to see where the study fits into the overall treatment landscape. Each study is like a piece in a larger puzzle. And you need to see the entire picture. You’ve got to be able to put together all of the pieces to see what makes the most sense for the patient sitting in front of you.
It’s not easy, but nothing worth doing ever is.
Closing Thoughts
If you’ve stuck with me for all 4 parts of this series (spanning nearly 2 years, I’m sorry to say), thank you. I’m not sure these posts are able to teach you to read and understand every paper that comes your way, but I hope they help.
Really, the only way to get “good” at literature evaluation is to practice it. The more you read and discuss with others, the better you’ll get.
If you have any questions on something I covered in this series (or on something I missed), reach out to me at brandon@tldrpharmacy.com. I’d like to create more literature evaluation resources on tl;dr pharmacy, and your input will really help me do that.
Get This Series as a PDF!
Want to save this article to view offline? Or have a more printer-friendly version? You can get the entire series of How to Be Awesome at Biostatistics and Literature Evaluation as a single printer-friendly and convenient PDF.